Let’s keep this post to the point. Hopefully you’re at least vaguely aware of this Super Event Theme I’m talking about (from my last post as well as the chat room) and are intrigued by it’s potential prospects. You know my current favorite three candidates to ride this S.E.T. wave are $DFCO, $OCLG (yes even though it’s on the EM) and $MIKP and I believe all three are great holds or adds here ($OCLG on the EM means for US traders that’s not an option right now even if you wanted shares). Beyond just those three though, what are some other possible S.E.T. style plays? Or better yet, what do we all need to look for so we all know how to spot the best candidates?
This general theme can be broken down into 4 major setup criteria, and then one final confirmation criteria. I believe the most upside will be available if we’re able to spot the setups sometime in between the 4 key criteria being set in place and (before) the 5th key element confirms the event, and get in during that window of time.
The 4 main setup criteria to look for are:
- First and foremost, these plays all seem to be shell style plays and that’s critical. Most will be old defunct or quiet shells that tease a reverse merger or something of that nature (some will word it as acquisitions or maybe even joint ventures). Regardless of the precise story and time line, the general idea to start off with is a dormant shell has shown some level of activity towards coming back to life within the past 5 or so years.
- Because this theme involves dormant shells or at the least very quiet stocks/companies/stories that are ignored largely by the retail markets, there should be a long multi year basing/sideways/flatlining period of some sort. I’d say at least 5 years of basing but ideally upwards of 10+ years. The bigger the base the better, usually, however it’s pretty rare to see the 10+ year bases.
- The next key to look for is a major breakout event from that long base, and as I mentioned many of these will have had that breakout event sometime in 2021. I can’t stress this enough, this major breakout event has to be a breakout to new secular highs, which is why there first needs to be a big base before this move.
- After the base has been built on the dormant shell and after it’s broken out of that long term base to new long term highs, the final criteria for the setup is for a pullback/correction (or even another dormant phase entirely) which firmly resets the market after the 2021 madness. Since most of these ran hard in 2021, most seem to be at least 1 – 2 years deep into their corrections and reset.
So that’s the setup in a nutshell. You need a long defunct shell that flatlines for a good 5 to 10 years (where the float largely gets locked up), you need the first trigger on the story/bull market to take the stock to a new long term high (fueled by the merger speculation), and then finally you need the retail market to have moved on and forgotten about the stock while it bases and possibly gets ready for the final step. Confirmation.
The final criteria for the confirmation stems from a resumption of the merger story while the retail market has long moved on, thus creating a reversal and an eventual panic buying spree as buyers flood back in, and then testing/breaking the 2021 peak highs. The 2021 highs were the first breakout to new long term secular highs, but the real confirmation of long term craziness comes when the market makes a subsequent new secular higher high. The problem with waiting for this confirmation of new long term secular highs is you buy into a red hot overbought market, which is a problem for me personally for a number of reasons. Take $SPZI for example, if you gambled at the 2023 floor you would have been able to ride a 25x move just to text the 2021 peak, and now it looks like it’s put in that confirmation second higher high on a secular time frame, which in time should lead to more squeezing.
I’ll share an example of a stock that meets the first 4 criteria but has yet to put in the confirmation. This is just a random example for educational purposes, but it certainly is a good watchlist addition for your S.E.T. watchlist.
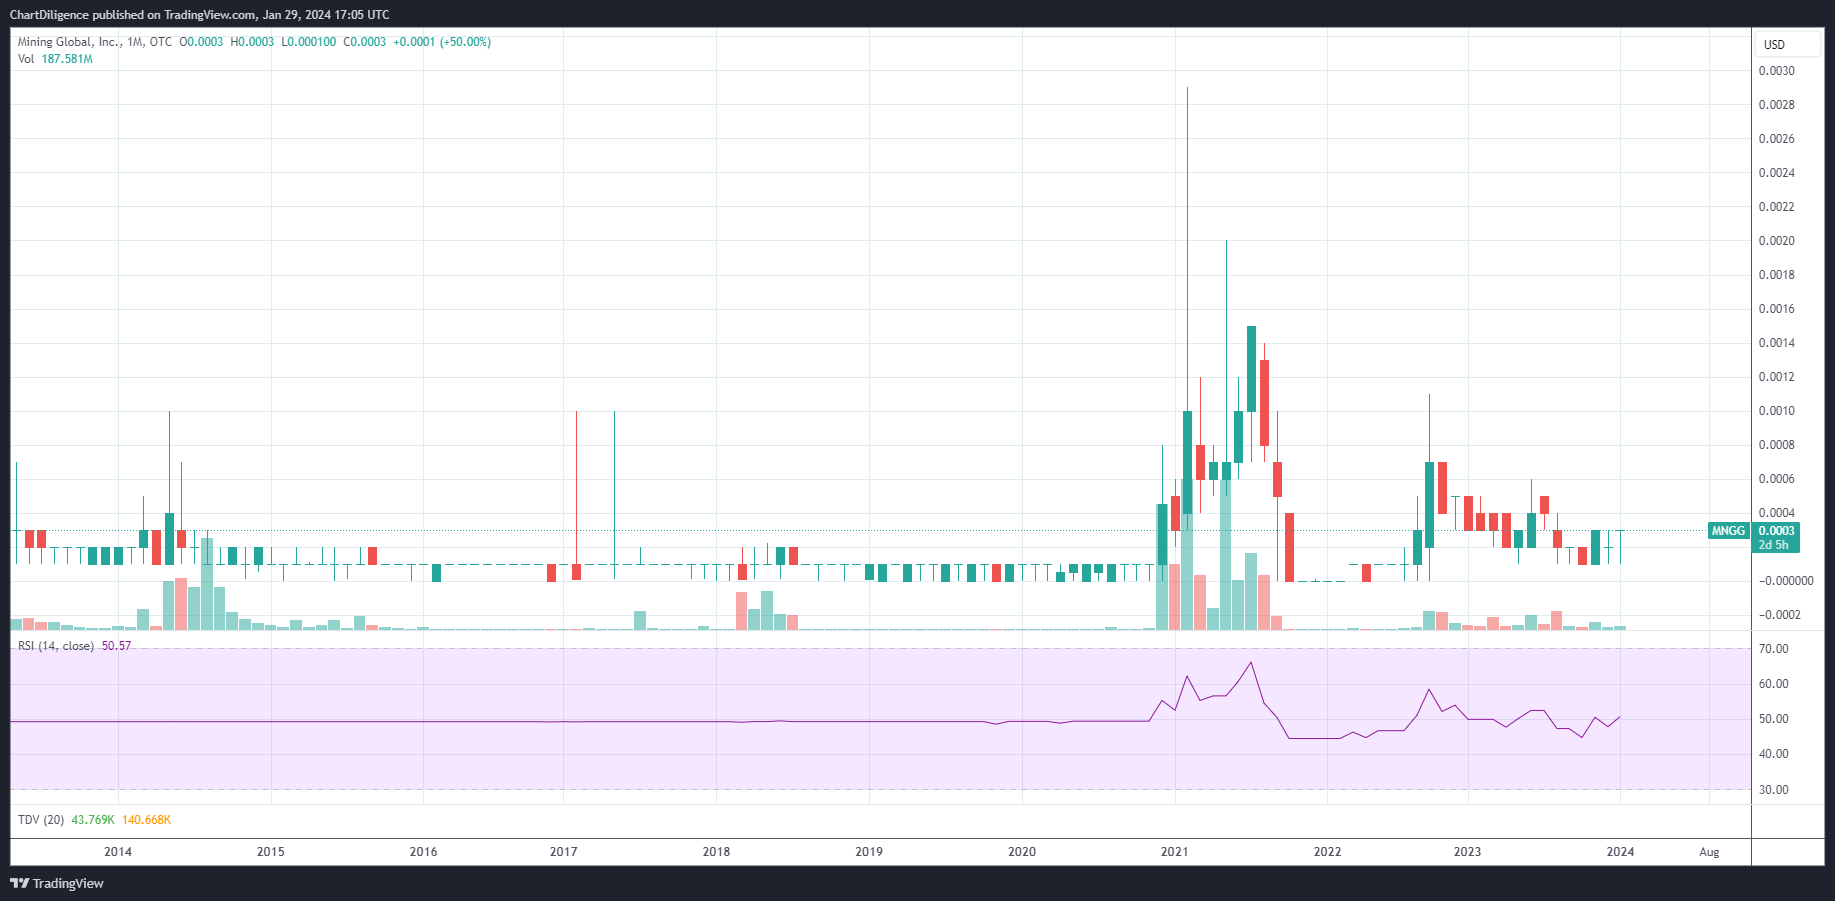
$MNGG is:
- a shell/merger style play first and foremost
- has a 5+ year base of sideways trading (7+ years, so pretty decent)
- The 2021 revival was a break to new 7 year highs thanks to that prior base, thus making it a new long term higher high
- The retail market has since moved and reset the market/chart for $MNGG
All those things being the case, the stage is set for the potential confirmation, ie testing/breaking and then holding the 2021 peak levels, ie putting in a second secular higher high.
Hopefully that all helps spell out precisely what to look for. Quite often finding good long term chart sources is difficult, making this task tough without having multiple chart sources. I personally use TradingView, StockCharts.com and BigCharts.com for most of my charts. If I’m right about this and there are more than a few OTC stocks which go on to make second long term/secular higher highs, it’s going to be an even wilder market than 2021 was. Be ready.
Edit: If you measure the distance traveled from the post 2021 lows to the 2021 highs, the closer those lows are to that peak the better. That is to say, the shorter the path to return to those 2021 era highs, the higher chance it is that the market is going there. $SPZI was roughly a 25x move from it’s floor to revisit it’s 2021 peak, so that goes to show you they don’t really need to be THAT close to trigger this theme. That said, if you can find plays that only need to move 10x or less to revisit their critical long term prior high, that’s all the better.